A couple of weeks ago, we looked at how the league could “lie” (here), basically comparing the actual points of teams last season (results) to their statistically derived Expected Points (performances). We explored how Sundowns 23-points gap to second at the end of the season was less than four in Expected Points terms, suggesting that the gap between them & the nearest teams was not “THAT”" big. Indeed, those to nearest challengers are MTN8 finalists this weekend & have dominated the Cup scene in the last two years.
The table below is the new season version of the Expected Points table, once again whispering how many points a team should have earned based on underlying statistics such as shots, possession, and Expected Goals (xG) and xG Against. At the moment, we note that the sample size is still very small (so hold out on the conclusions). But with a month to the next round of games, this is probably a good time to take a peak at what’s going on away from the mainstream table.
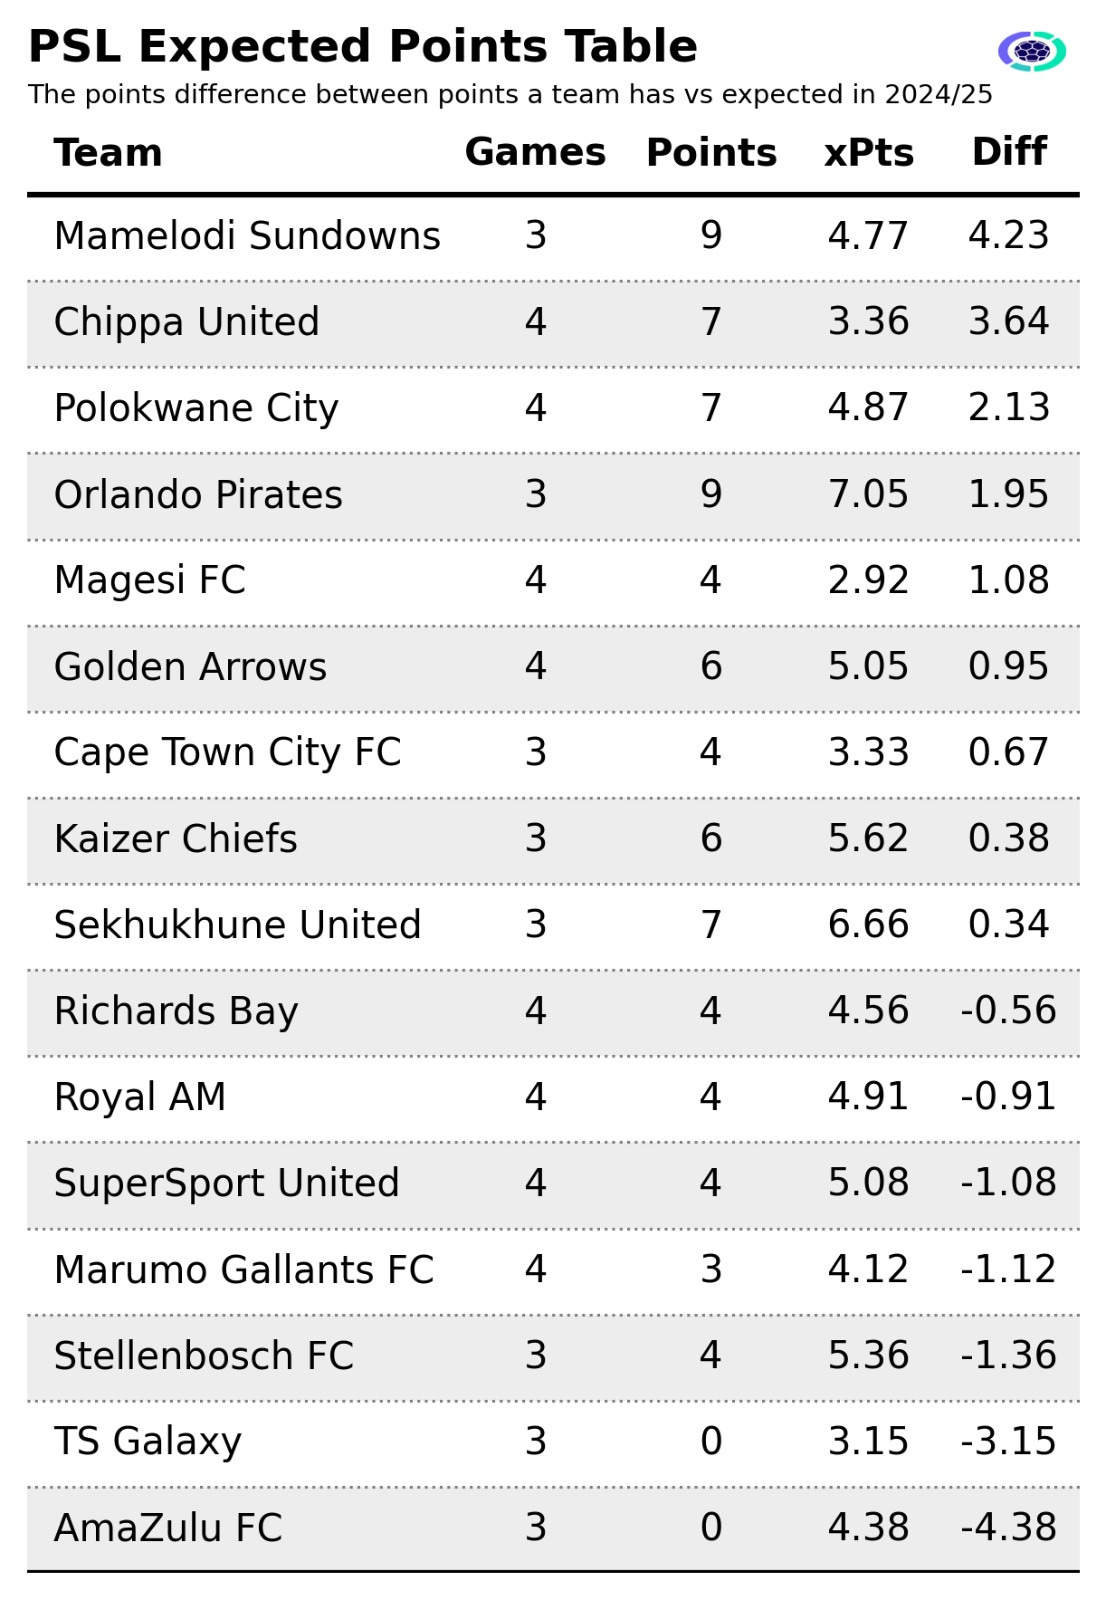
The Expected Points Table: a positive value indicates the team has over-performed relatively, while a negative value suggests the opposite.
Overperformers
The best place to start is with teams that seem to be over performing. Like last season, Downs sit at the top of the table, with the biggest gap between points (9) and Expected Points (4.77). Their difference of +4.23 suggests they've significantly outperformed expectations in the early part of the season however we have to consider that they have consistently outperformed this metric for the last 6 seasons. So, this isn’t a bad thing on its own - but an early warning (just like the Chiefs game) to their opponents that Sundowns can win even if they don’t look like the best team on the field. It’s just what champions do.
Chippa and Polokwane City also pop up on the upper end of the table, having “dropped” 3.6 and 2.1 xPoints respectively in their games. They’ve played a game more that other teams, so that’s another factor to possibly consider here. Orlando Pirates have also started the season strong with 3 wins from their opening three games. The attack has flourished with six goals in their opening three games and defensively conceding just one goal as well. While they have 2 less points than “deserved”, they are currently the team with the highest xP in the league.
Thanks for reading Laduma Analytics’ Substack! This post is public so feel free to share it.
Underperformers
TS Galaxy and AmaZulu FC are the biggest under-performers of the season to date with both teams yet to collect any points into the 2024/25 campaign. Based on both team's performances, we would have expected them to have around 3.15 and 4.38 points on the board. It's even an aspect that AmaZulu FC's now-former coach Pablo Franco Martin referred to in his post-match press conference against Kaizer Chiefs, highlighting that:
"The start of the season has been unfair to AmaZulu…"
To be fair, the first three games have been a bit unlucky for them, conceding six goals from 2.41 xG Against - the highest difference in the division (3.59). Other teams slightly underperforming into the early season are SuperSport United, Marumo Gallants, and Stellenbosch FC.
Par-teams
AmaKhosi has been somewhat rejuvenated by what new coach Nasreddine Nabi has brought in. They have two wins in his first three games, including the hot-topic loss against Sundowns, and the team currently sits on six points which matches expectations under the Tunisian so far. Alongside Chiefs, Cape Town City, Sekhukhune and Richards Bay are other teams more or less on par. City have seen a mixed start to the season for Eric Tinkler and his squad. Three games (1 win, 1 draw, and 1 loss) has them sitting on four points close to where we would expect them to be.
A word on Sekhukhune
Sekhukhune United are yet to lose a game and are only one of four teams still unbeaten in the new campaign. Babina Noko have started strong with two wins and a draw to sit on seven points (their best start to a season).
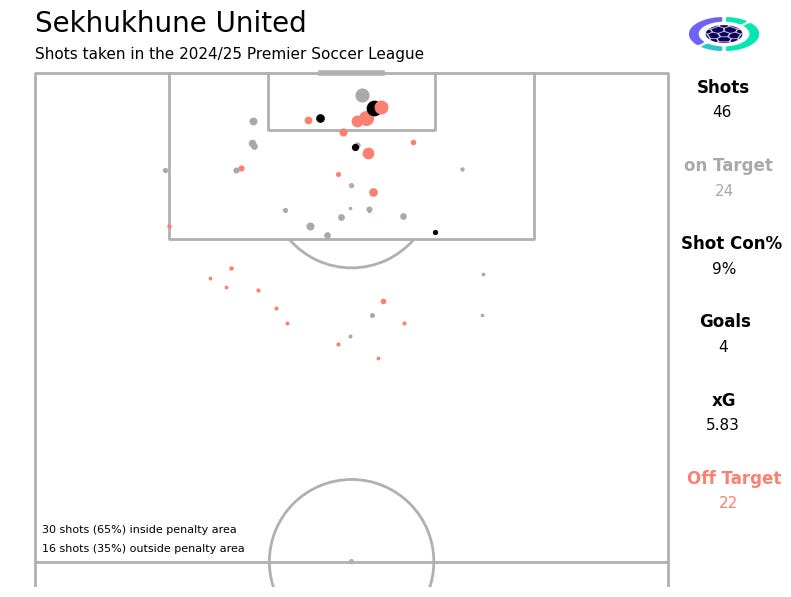
Their xP tally of 6.66 from their opening three league games is the second best in the league, while they lead on both xG and xG Difference (xG minus xGA). Table below. They have been wasteful in front of goal however, converting 9% of their shots (including blocks), below the league average 10%.
Originally, we planned to release these table at the end of September, hoping this would after the conclusion of Q1 (8 games each), but the (1) league delay and (2) month-long international & Cup break necessitated this adjustment (editorially still worth a glance). We’ll still do the Q1 xPts table with a larger sample of matches, and that will undoubtedly have more value. Look, at least you get another newsletter.
Other available tables sent to paid subscribers :
2. Goals v Expected Goals Table
Offensive efficiency; Sundowns, Chippa, Polokwane on top
3. Goals Against v Expected Goals Against Table
Defensive efficiency; Magesi, Royal AM, Sundowns on top
4. xG Difference Table
Net efficiency - defensive & offensive: Sekhukhune, Pirates & Chiefs on top