Ocean’s Eleven, the 2001 heist comedy celebrates its 25th anniversary in a few weeks. If you’ve seen it (or are old enough to remember), you know the gist - eleven men come together to rob a vault in a Las Vegas casino.
In the end, it’s Danny and Linus who get down to the vault and open it, getting access to the cash. None of that happens without the other nine members of the crew, who were involved in planning, getting into the casino, tripping the power and cameras etc. So when they take the money, they split it among all of them, with everyone involved getting credit.
In football, we often do the opposite when a goal is scored. We credit only the goalscorer (Danny) and the assister (Linus), when there were many others involved directly and indirectly in the build-up. It’s how we’ve been trained to watch today’s football - remember mainly who scored and who set them up. We even have a term for it - “goal involvements.”

For a while, the pre-assist (the pass before the assist) was a thing, but even that has faded from common football terms, replaced hesitantly by terms like expected assists, key passes and their better-known cousin ‘chances created’. All these have been trying to solve a modern problem - how do we measure a player’s involvement in a team’s attack beyond goals and assists. Mention pre-assist at the stadium, and you will get the looks.
But the idea is not too far-fetched.
Attacking Sequence Involvement (ASI)
Event data has some limits. We can tell who had the most passes and most assists, but those are just moments and snapshots. Run them through the maths, and we go from stills to motion pictures. It’s one thing to list who made the most passes in a game or season, it’s another to pick whether those passes contributed to shots and goals. We’ve previously looked at pass clustering, and sequencing does something different. It helps us follow a single move from start to finish, tracking who is involved in building a chance.
Opta defines a sequence as a passage of play that belong to one team is are ended by a shot, a stoppage or the opponents winning the ball back.
For this piece, we isolated every open-play passing sequence that ends in a shot, and credited each player involved - i.e their attacking sequence involvement. The PSL averages 12 shots a game, with about 9 of those coming from open play. That’s a lot to work with - more than 1000 open-play chances even so early in the season. So each player who touched the ball along the way to a chance is credited, whether he took the shot, created it or was involved earlier on. None of this is new to sport. In ice hockey, one goal can hand out zero, one or two assists.
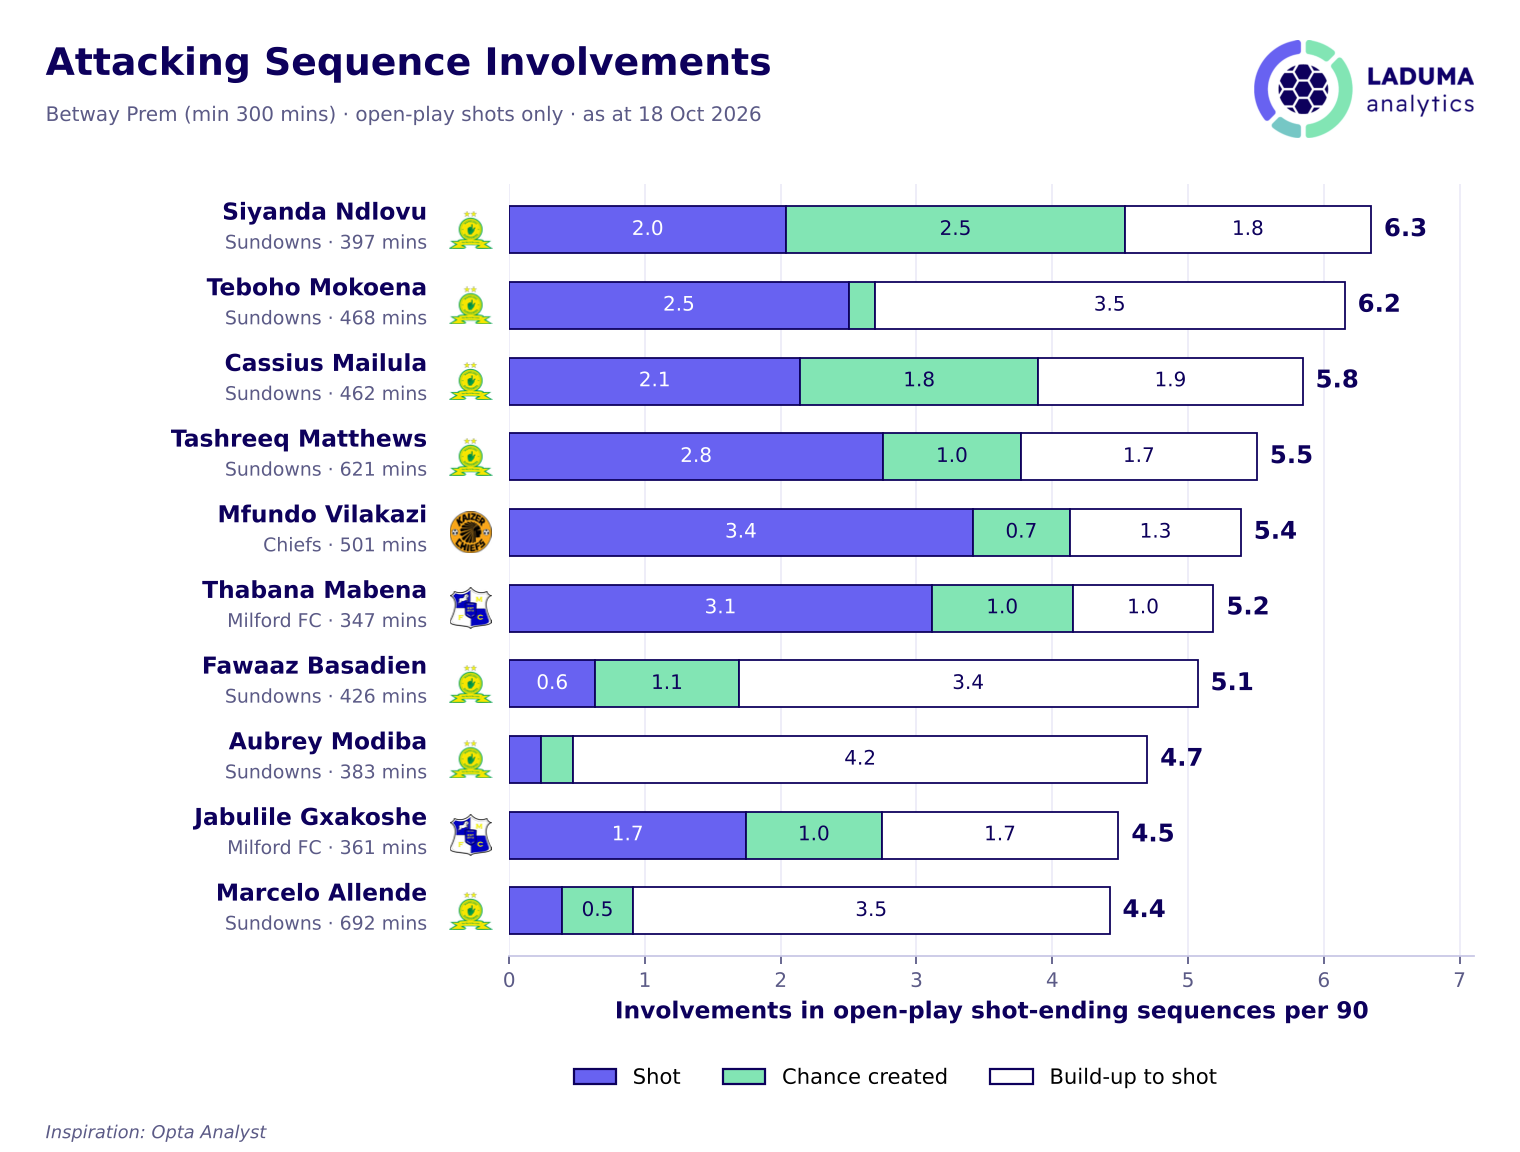
The leaderboard has Siyanda Ndlovu as the most involved in his team’s attacking sequences in the league (per 90 minutes). Put simply, he takes 2 shots himself, creates 2.5 for teammates and turns up in the build up to another 1.8 on average.
Seven of the top ten are Sundowns players, and before we read too much into it, it is worth saying that this mostly reflects their style of play. Their 68% average possession is comfortably the highest in the league. They keep the ball better than anyone, and build up slower than all teams. On average, Sundowns shots go through 3.6 players - so there are more ‘feet’ on every one. Compare that with Pirates, whose moves run through 2.1 players on average, because they are more direct. We can always isolate this for an individual team, and see who drives each team’s attack.
That’s just the raw count.
Weighting the chances
The raw count has one major problem. Like assists, a move that ends with a speculative shot from distance counts the same as an intricate web of passing triangles that ends in a good chance. A player can be high on this list based on involvements that never trouble the keeper.
StatsBomb tried to fix this with xGChain. Instead of giving the same credit for everyone in every move, each player is credited with the xG of the shot his involvement produced. A defender that stars in several moves that end in nine small-chance shots gets less than an attacker in three moves that end in big chances. It is no surprise that the list favours attackers.
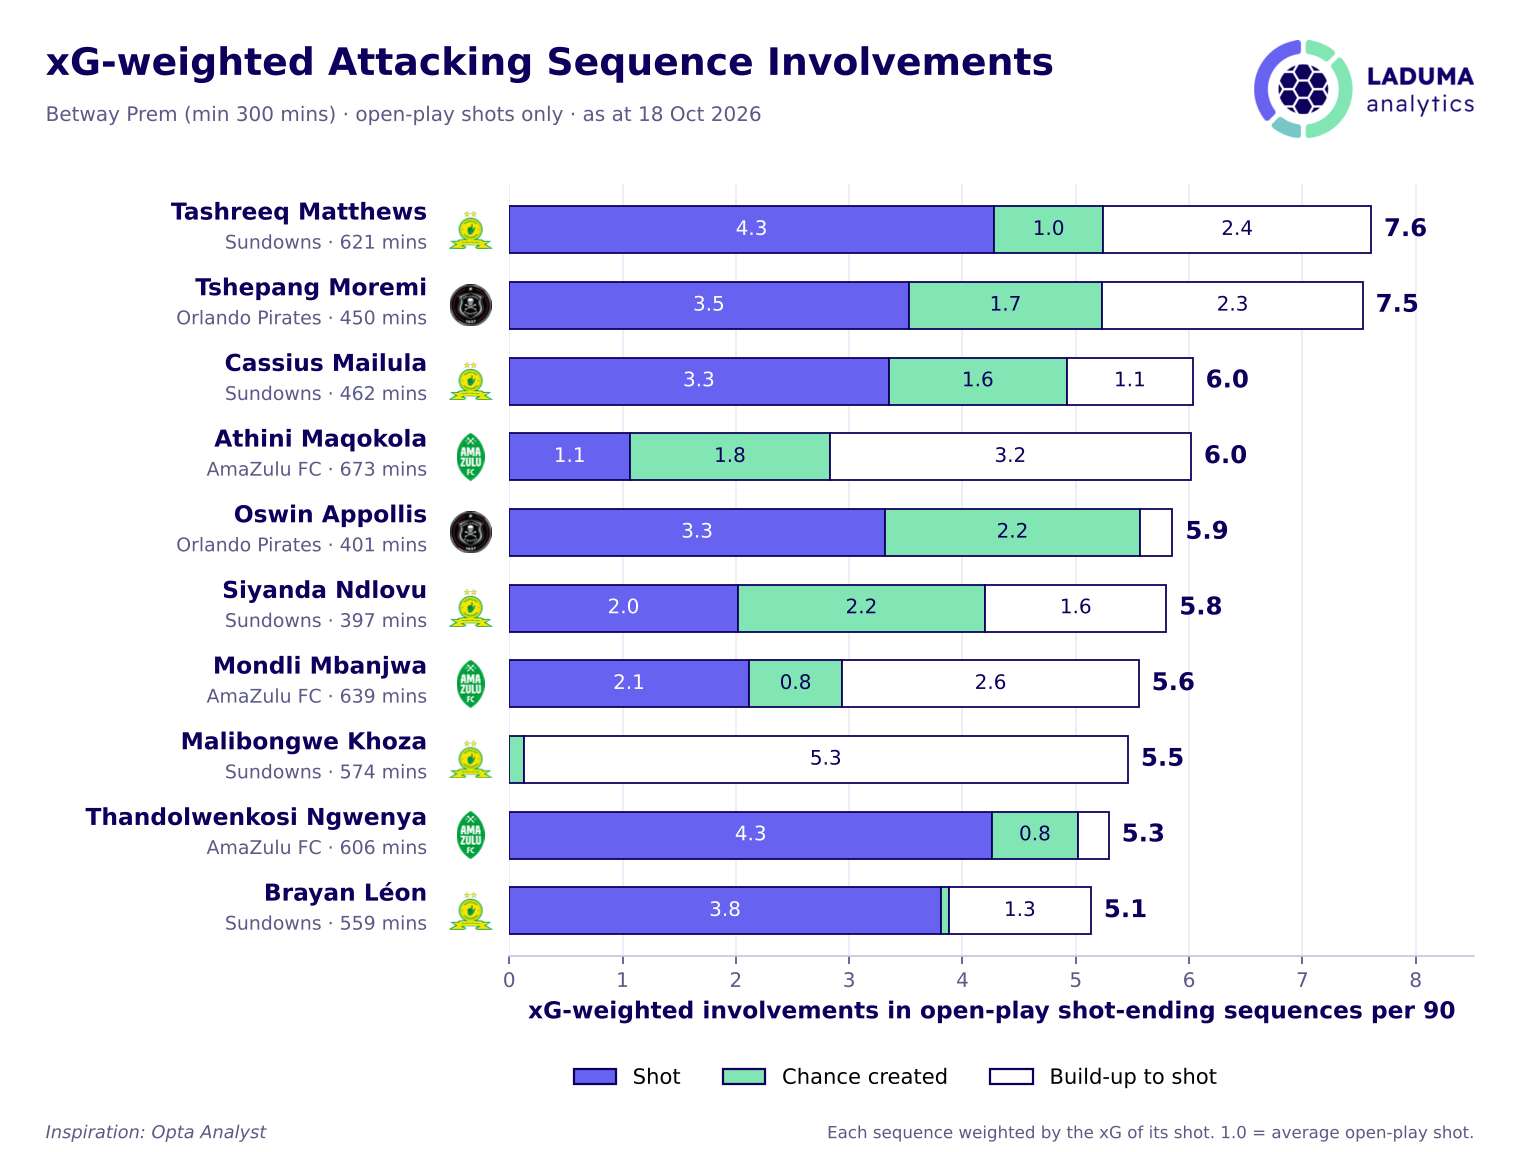
Suddenly, we have AmaZulu and Orlando Pirates players, and every name in the top ten belongs to one of the league’s top three teams. It’s essentially a shortlist of the attackers the top three teams rely on, the ones an opposition coach may plan around.
Siyanda Ndlovu, who led the raw count, slips to sixth once chance quality is baked in, on 5.8. Supposing one average chance is worth 1.0, that’s 5.8 average chances he has a hand in per game - 2.0 of them from shots he takes, 2.2 from chances he creates and 1.6 from build-up earlier. Tashreeq Matthews is the player most tied to his team’s best chances, with Tshepang Moremi just behind.
Pirates take fewer shots than Sundowns, but create higher xG with those. Downs may be patient in build-up, but Pirates are patient in shot choice. Each player’s number is now weighted by the quality of the shots his moves produced, measured against the league average open-play shot (worth 0.103xG), per 90. Here is the working:
xASI₉₀ = (90 / M) × Σ ( xGₛ / x̄ )
In non-mathematical terms, players get points for being part of a chain that ended in a shot, but the clearer the chance you helped build, the more points they get. In Ocean’s terms, the bigger the job, the bigger the reward.
What this doesn’t tell us
Like any visual, there is the silent question ‘what am I not seeing?’. For starters, we only measured moves that end in a shot, and excluding, say, brilliant build-up that ends in a crunching opposition tackle before a shot goes off. Mostly ASI counts that you were in the move, but not your impact in it - the simple square pass counts the same as a defence-splitting pass. A possession-value model like Expected Threat (xT) solves some of this, so maybe read the two together. We’ll run this again later in the season, with xT, set-pieces and style adjustments built in.
Even so, ASI is a notch better than goals and assists - everyone gets some credit, not just Danny and Linus.
This newsletter was sponsored by Easybet, whose support made this edition possible. Use code LAD50 at Easybet: http://bit.ly/LAD50