With nearly 100 of the 240 league games played, the season has reached a significant mark analytically - representing 39% of the entire season, and past the “small sample size” territory. If the season were an 8am-5pm working day, we’re at approximately 10:30 in the morning - enough time has gone by to draw some conclusions on how the rest of the day will go, based on available data. Back to the football - the question we sought to answer was - which teams have shown significant fluctuations in either box this season, as measured by Expected Goals & Expected Goals Against. Think of it as a progress report from last season if you will…
Progress Reports
Looking at the league table can give us a glimpse into which teams are doing well, but it has limitations for tear on year comparisons. PSL teams often have inconsistent fixture loads at any point beyond August, making points totals hard to compare. We could compare teams to where they stood exactly a year ago (the week starting 18 November) - and observe Pirates were 1st, Sundowns 2nd, Stellenbosch 3rd, Sekhukhune 4th, and notably AmaZulu were 14th and TS Galaxy 15th.
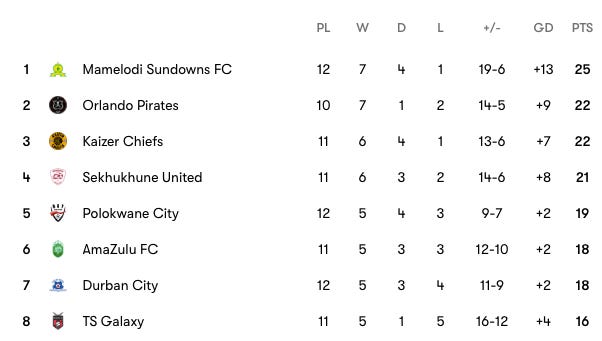
Yet, in doing that we face another problem - fixture differentials were already at play - Pirates, Stellenbosch and Chippa team had more games than others, but it was only seven at this time last year - some teams had four. This is before we even factor the Royal AM games that had to be expunged into the equation. To bridge some of these limitations, we’ve decided to compare xG per 90 minutes standings for both attacking output (xG for) and defensive resistance (xG against).
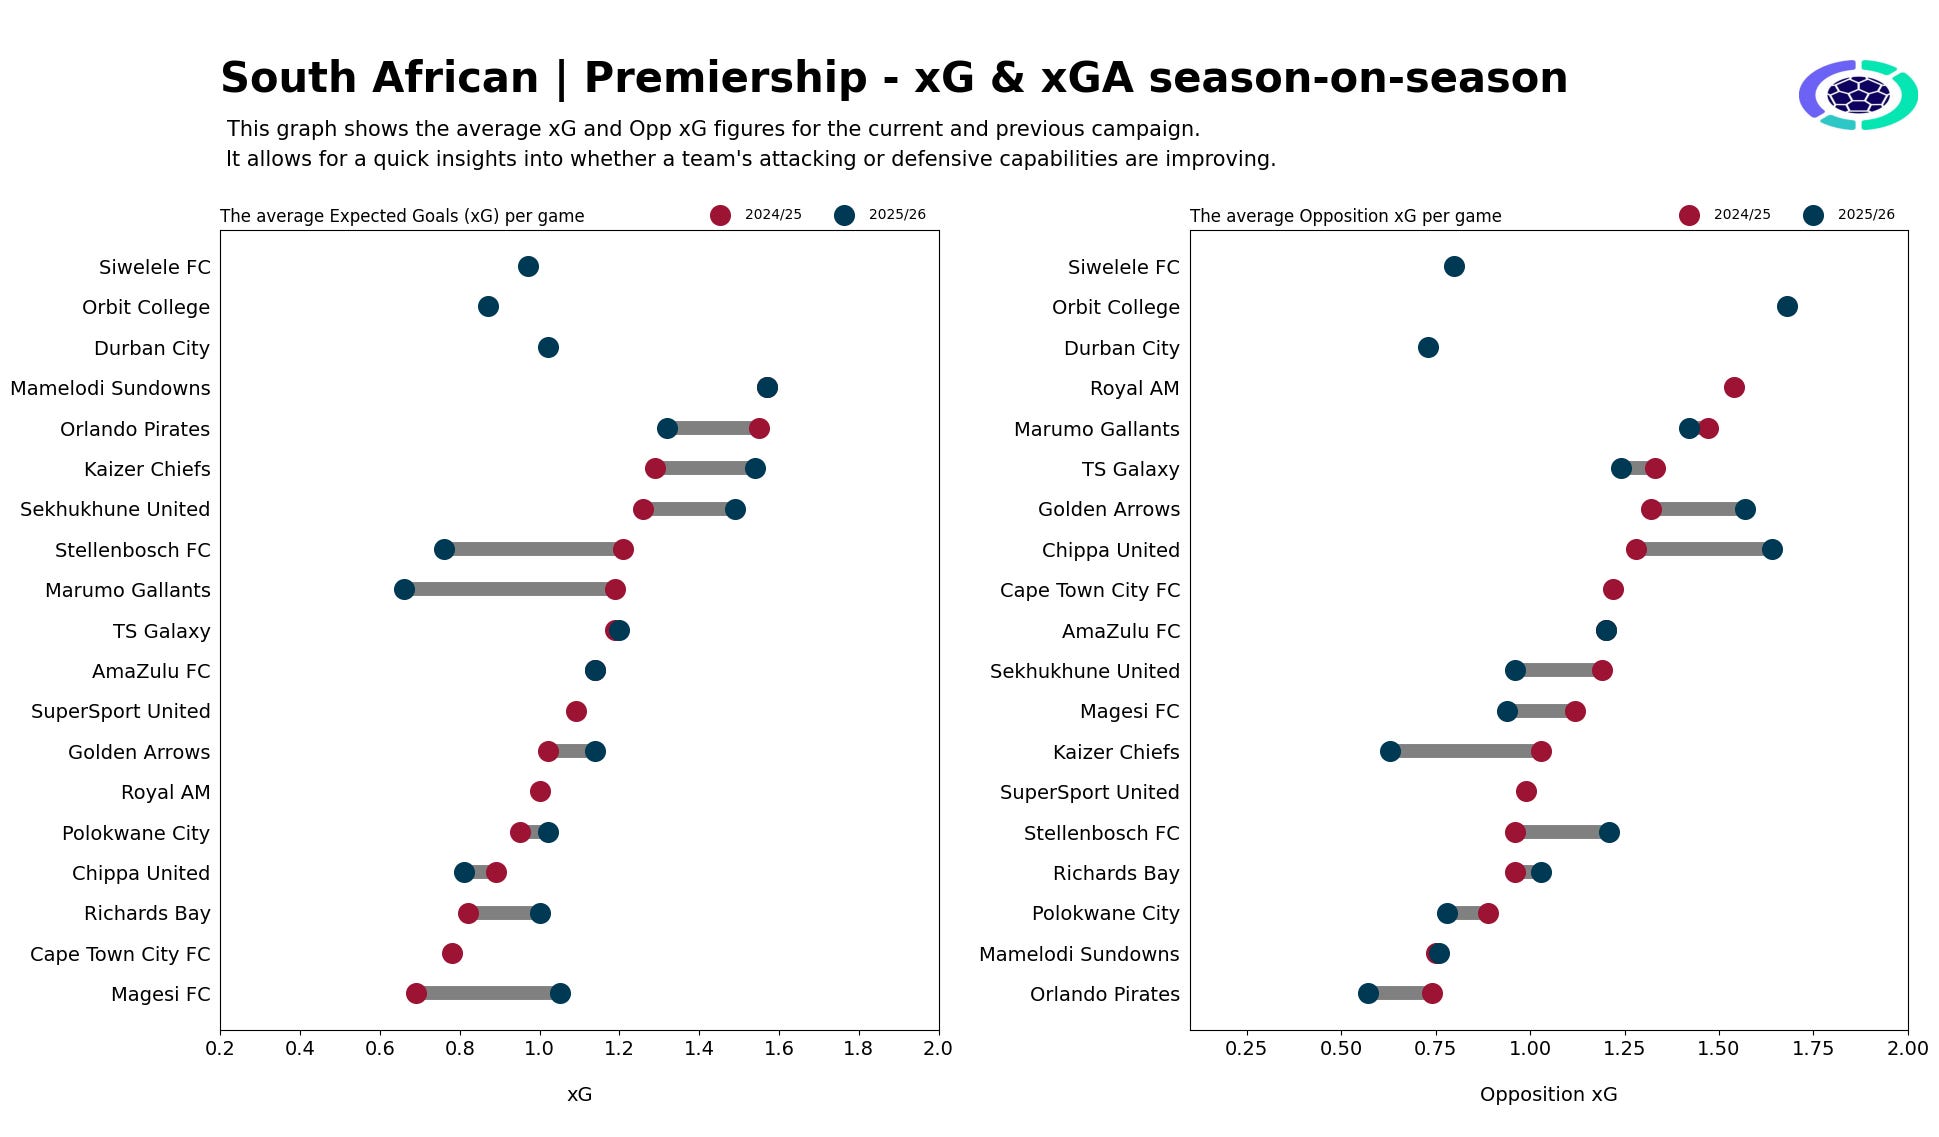
Red: last season 🔴
Blue: this season 🔵
Offensive progress: Magesi, Sekhukhune United, Kaizer Chiefs
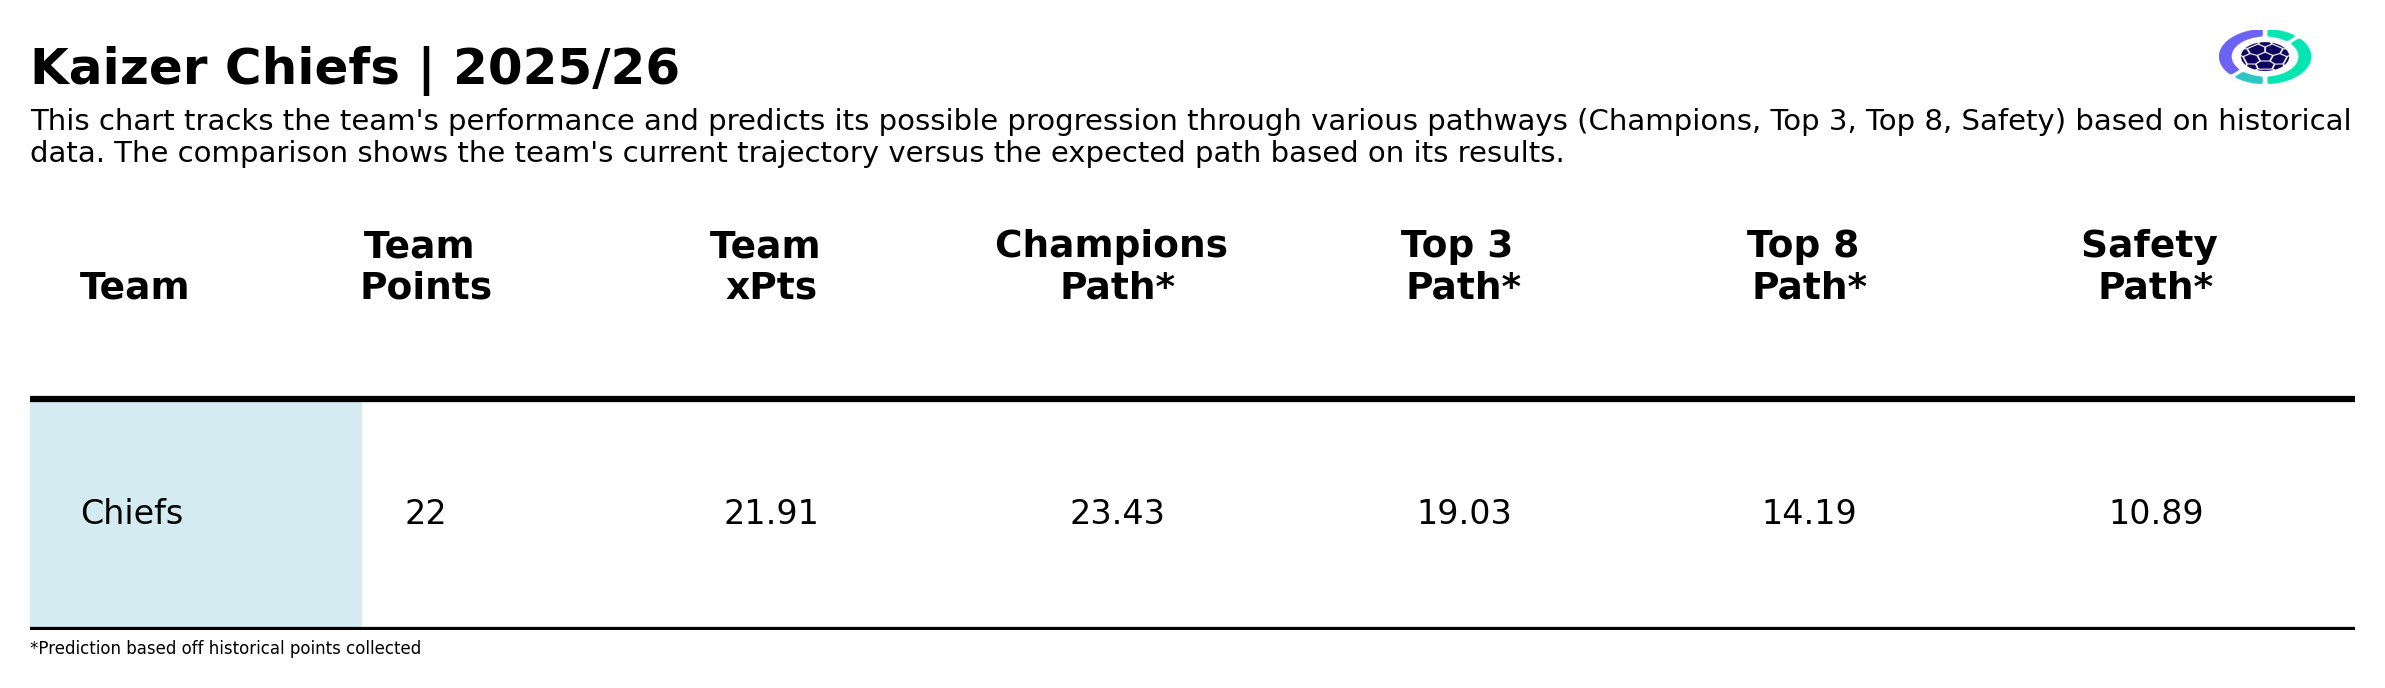
From an attacking perspective, Magesi have the biggest season-on-season increase in chance creation quality per game up from 0.7xG to 1.1xG per 90. That said, the context is a low baseline from last season, where they were the worst attacking team in the league. Sekhukhune are another example of a team whose attacking output has improved, despite dropping points in recent games. They have become a difficult fixture for most of the big team . Kaizer Chiefs should also be encouraged by how their campaign has started, now averaging 1.54xG per 90 compared to 1.29xG last season. Overall, they are on course for a Top3 finish based on Expected Points (a game-by-game extrapolation of the underlying xG values) - though they remain marginally short of the numbers historically needed to sustain a championship run.
Offensive regress: Stellenbosch, Marumo Gallants, Orlando Pirates
On the other hand, Stellenbosch’s struggles in front of goal are clear both on the actual standings and their xG per 90 output. They are currently the joint-lowest scorers in the division with seven goals from 12 games, and are also down nearly half a goal worth of xG per 90 compared to last season. Marumo Gallants and Orlando Pirates join them among teams recording significantly lower xG per 90 this season. With Pirates, decline in attacking output is offset by improved defence which we see below - one could argue the former is a (deliberate tactical) consequence of the latter.
Defensive progress: Chiefs, Sekhukhune, Magesi, Pirates
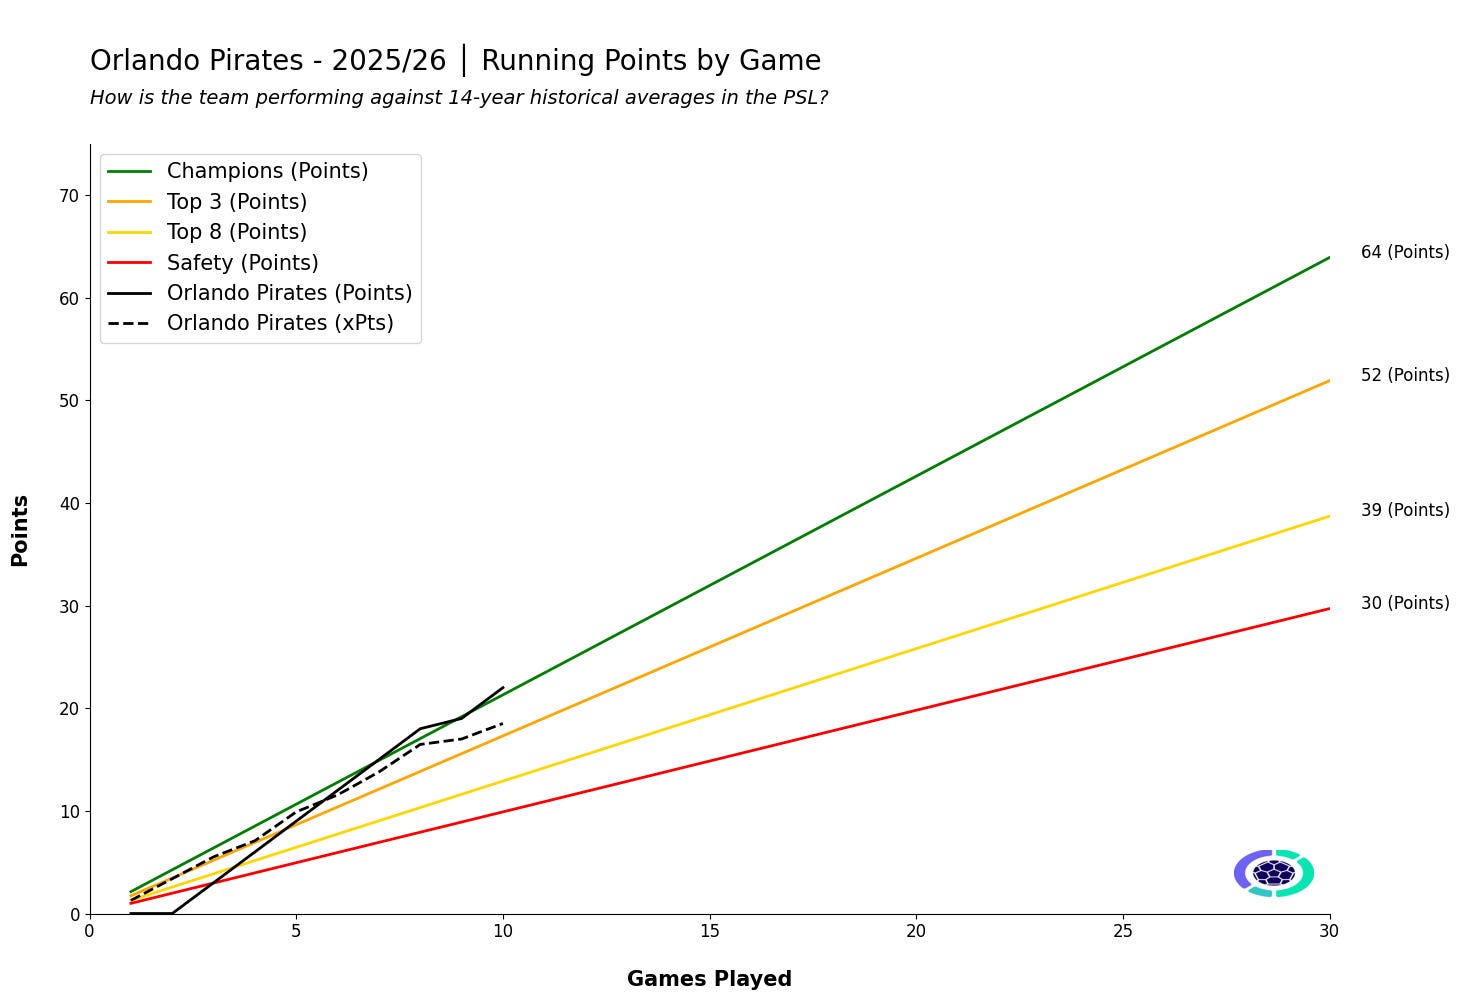
Kaizer Chiefs (0.4xGA suppression per 90), Sekhukhune (0.23xGA), Magesi (0.16xGA improvement) are the defences that have significantly restricted the quality of shots they are giving up compared to last season. 12 games in, Chiefs have already equalled their clean sheet total from the whole of last season (7) - further substantiating their defensive improvement. Pirates were the best defensive unit in the league last season (0.74xG conceded per 90), and they’ve retained that defensive status, with improvement. A league best 0.57xGA allowed per 90 paired with a league best 6.6 shots conceded per 90 has resulted in a league best 5 goals conceded. 10 games in, Pirates’ points are on the champions path, thought xPts has them slightly lower down.
Defensive regress: Golden Arrows, Stellenbosch, Chippa Utd
Golden Arrows, Stellenbosch and Chippa Utd are three teams who have taken the biggest steps backward defensively. Their xG conceded per 90 has taken a knock, with Chippa United’s case particularly concerning. Last season, Chippa’s defence was 4th worst on the xG table, but their actual goals conceded was solid Top 6 level - a combination that kept them afloat. This season, however, they boast the worst xGA numbers, and the second worst goals conceded record (both goals and non-penalty goals conceded) - an unhealthy combination of poor performance and results.
Critically, none of these metrics are reasons to cheer or panic as standalone stats - we need to dig deeper into the why by juxtaposing xG numbers with shooting profiles and playing styles, isolate non-penalty and set-piece related xG among other things to get a full picture. Plus, this compares a full season baseline with just one-third of this season - one third vs one third would be preferable, it’s hard to do due to inconsistent fixtures etc. Hence a Sundowns, for example, are notably absent because they haven’t “improved” on any of the above, but that’s mainly to do with how high they set the standard last season. They’ve actually maintained their 1.57xG per 90 despite mixed results, with 0,75xGA & 0.76xGA pretty similar defensively. That said, these stats can be useful as a starting point helicopter view of teams’ progress.
For more granular analysis (including in-depth single-team or opposition reports), PSL clubs are encouraged to get in touch via info@ladumaanalytics.co.za 📧