The first “batch” of Premier Soccer League games are behind us, and the international break gives us a chance to look at some interesting developments in the league so far. Only 28 games have been played (was 66 games on this same day last year), mainly because the league started late. Not all teams have points on the board (14/16 do), but every team has scored at least one goal. That’s where today’s newsletter is digging into. Altogether, we’ve seen...
54 goals scored
43 inside the box (80% of the total, was 88% last season) [-]
11 outside the box (20%, was 12% last season) [+]
19 left footed (35%, was 31% last season) [+]
23 right footed (43%, was 50% last season) [-]
11 headed (20%, was 16% last season) [+]
Only 14% of the season has been played, so things will change a lot, even as early as the next international break. The only top-line numbers that really stand out are the increase in goal outside the box - one in 5 goals comes from outside the box this season, whereas it was one in 9 last season. This also, may even itself out soon.
One step back: Where do the shots come from?
Preceding the (54) goals are shots, and the visual below shows where each team shoots from. Last week’s newsletter focused on Sekhukhune, who lead the league in terms of xG and xG Difference (xG minus xGA). We shared their shot map as part of an analysis into how they’ve started the season well. This week, we’re looking at all the teams (in one visual) for more context.
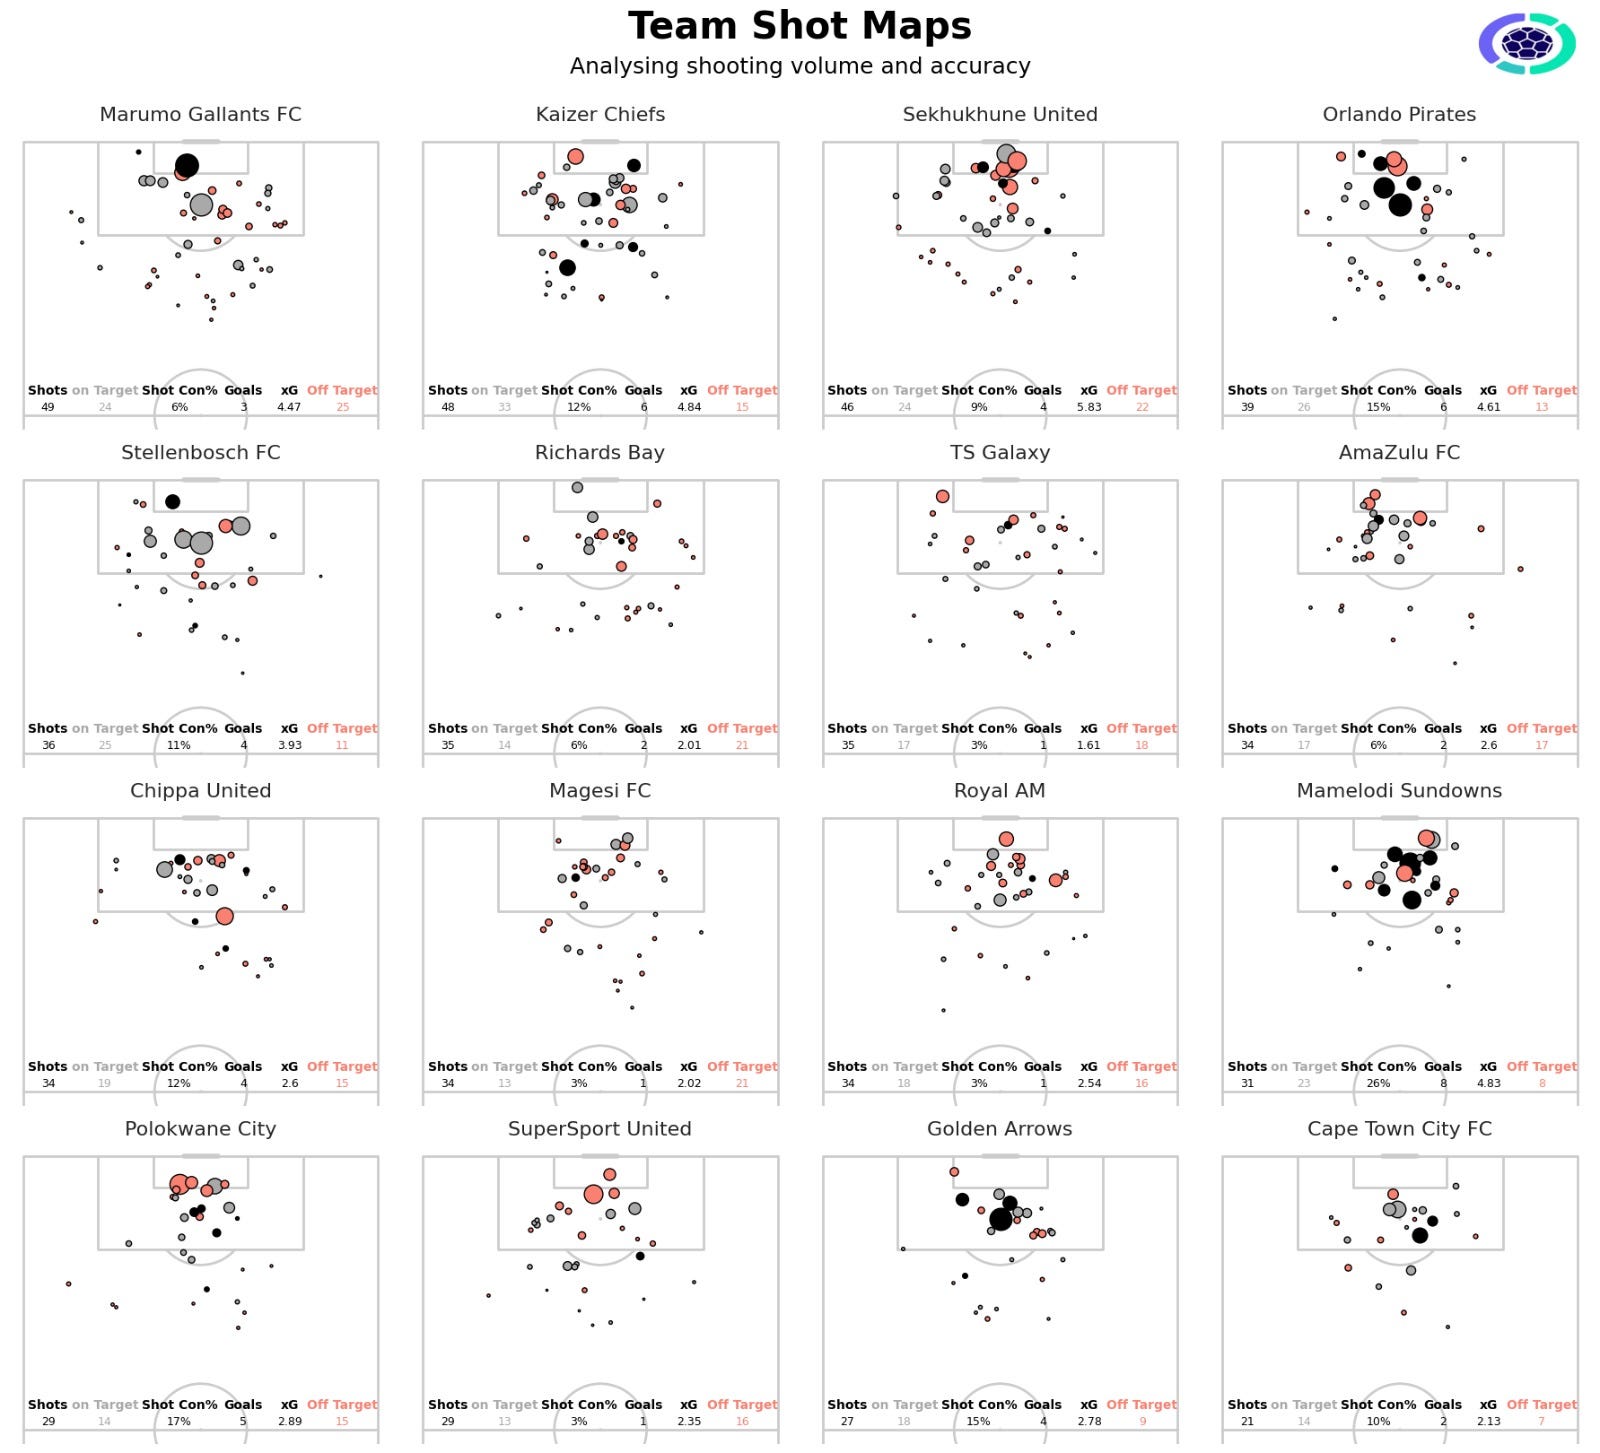
The visual highlights shooting volume and accuracy of all 16 teams so far. You may need to zoom into your favourite team. Already, Sundowns’ ruthlessness in front of goal catches the eye. Downs 31 shots is 5th lowest in the league (and below the league average of 36), but that uncharacteristically low volume is offset by a 70% shot accuracy, the highest in the league. Their 26% shot conversion is at least 10% higher than the next best team, and 16% above the league average. While this will likely decrease in the coming weeks (Downs were at 13% last season, and first in the league), it may come once they’ve opened up a gap at the top of the table.
Royal AM, SuperSport, Magesi, TS Galaxy are converting only 3% of their shots so far, a discouraging return. In fact, the majority of the league (9 of 16 teams) all fall below the league average (9.4%) at the moment. In all likelihood, the league average will stay the same - it has been hovering on the 9% mark for a few years now - but you need both volumes, and accuracy to climb higher up the table. For example, Golden Arrows were second in shot conversion last season (12%), but 15th for shots taken, and their low shot volumes neutralised the good finishing.
Two steps back: Where does the final pass come from?
Another interesting angle to look at, while the data is still thin, is the source and direction of the final pass before goals are scored. It’s important to note that not every goal has an Opta-assist (roughly 2 in 3 goals do) - some goals are deflected into the path of the shooter, rebound of the keeper or are direct free kicks (including penalties). A fantasy game may give these as assists, but they are not “official” assists. This could be a newsletter of it’s own.
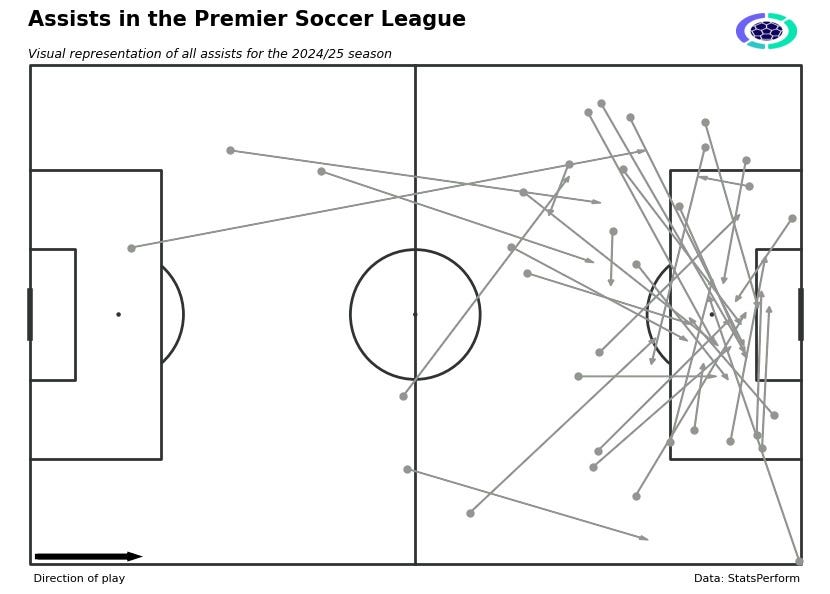
Like the black dots above (on shot maps), it’s no surprise that most goals come from the central locations. Teams need creators who can create high numbers of these “chances”, and strikers that can work their way into those positions. Unless you’re Golden Arrows goalkeeper Edward Maova off course - the closest dot to the left is his pass to Knox Mutizwa for their opening goal against Marumo Gallants.
Present European analysis is looking at the effectiveness of cut-backs in creating goalscoring chances (they are very hard to defend); and that is something we’re keen to dig into soon. Future analysis will also look at speed of passes, line breaking passes and more.
Stay tuned..