Expected Goals has taken over much of football discourse across the world, and we also use it extensively here. Whatever the limitations, it remains a powerful, objective measure of the quality of team and player attacks (and defences). Yet, simply looking at xG and subtracting actual goals to determine over- or underperformance is merely scratching the surface. Even per-game averages have limitations, and saying a team creates an average xG of 1.5 per game could (mis)lead people into believing they consistently create 1.5 goals’ worth of chances per game.
Consider two teams:
Team A’s xG totals in five games are: 1.4, 1.6, 1.5, 1.3, 1.7
Team B’s xG totals in five games are: 0.5, 3.5, 1.0, 0.5, 2.0
Both teams have an average xG of 1.5, but Team' A’s output is more consistent, while Team B’s output swings wildly from match to match. Relying on the mean or per-game stats can hide the truths about a team’s volatility, so the next step is to analyse the spread and distribution of match-by-match data. Enter Variance…
What is variance?
“Variance is a statistical measure of how spread out a set of data points is in relation to its mean (average). It quantifies the extent to which individual values in a dataset tend to differ from the mean.”
High Variance: Data is widely spread out, suggesting volatility and/or inconsistency.
Low Variance: Data is tightly clustered around the mean, suggesting consistency and predictability.
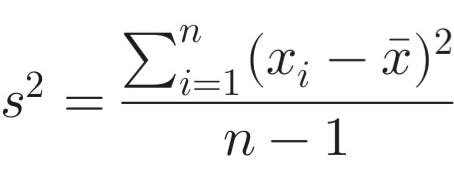
This is the formula, but we won’t bore you with the details.
Applying variance to PSL teams’ attacks
Analysing all 16 teams’ match-by-match data could be a tricky task. But that is precisely what box plot visualisations allow us to do. In one image, we can get a glimpse of how teams are able (or unable) to maintain stable, repeatable systems that consistently create high-quality chances. In a sense, this can be a tool for judging teams’ tactical stability.
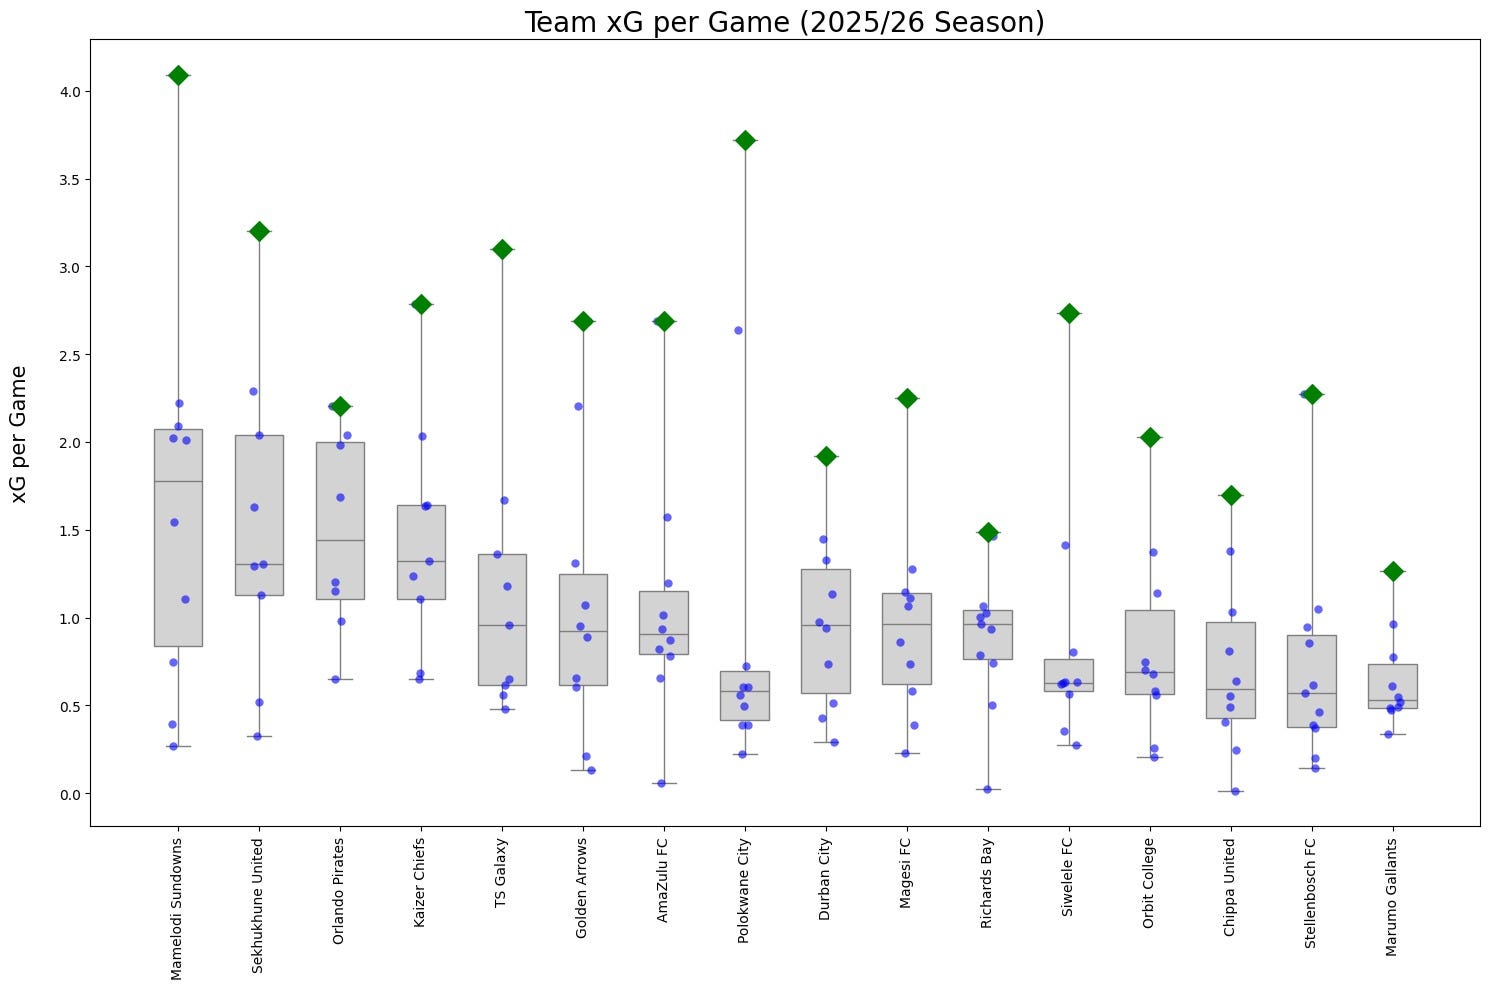
The box plot below shows Expected Goals output for every team in every match so far this season. Each dot is a data point representing a team’s xG total in a game. The visual provides three crucial metrics at a glance:
1. The Box (Inter-Quartile Range - IQR)
The grey box represents the middle 50% of the team’s performances. A tight box indicates a highly consistent performance output; a long box is the opposite.
2. The Line inside the Box
This is the Median xG, usually a better measure of a team’s typical output than the average.
3. The Whiskers
These show the extreme range of results for each, highlighting the maximum (green diamond) and the minimum (bottom line with dot).
For example, Sundowns is the first team in the graph. 50% of their matches produce between 0.8 & 2.1 xG (IQR); 1.8xG is the median for Sundowns’ attacking output; 0.3xG was their worst game (v Chiefs) and 4.1xG their best (green diamond).
Top 4 focus
Sundowns (1.7xG per game), Sekhukhune, Orlando Pirates and Kaizer Chiefs (all 1.5xG per game) are the most consistent teams in creating high-quality chances this season. It’s no accident that these four teams occupy the top four league positions.
Sundowns: Mean xG: 1.7 | Median xG: 1.8 | IQR: ~1.3xG
While Sundowns lead the league on overall xG, their longer box (an interquartile range of approximately 1.3xG) suggests dramatic swings in attacking output to start the season. The 4+ xG demolition of Richards Bay remains a massive statistical outlier (though the optimist may argue it shows what Sundowns can do on their best day). More concerning is that there have been three games this season in which Downs were restricted to less than 1xG - that’s as many times as it happened throughout last season under Miguel Cardoso. They even have two games with less than 0.5xG. It’s hard to predict Sundowns’ next performance given the above, but the high median (1.8xG per game) suggests they are still the best attacking team, dealing with the new tactical adjustments after the departure of the best player in the team & country.
Orlando Pirates: Mean xG: 1.5, Median xG: 1.5 | IQR: ~0.8xG
Pirates have one of the most fascinating profiles in the league. Their worst performance (0.7xG) is better than most teams on their best days - they always find a way to create high-value openings. Yet, an upper limit of 2.2xG is the lowest ceiling among the title contenders, which is precarious. They have not blown any teams away with great attacking performances - only once this season have Pirates scored more than one non-penalty goal in a league game. But do they need to? Under Ouaddou, Pirates have been served by a tactically conservative and defensively organised approach. Three months into the campaign, they have equalled their PSL club record for six consecutive league clean sheets. He may only whisper it indoors, but this box plot reveals a profile of a coach who prioritises structural stability & defensive shape over attacking aggression.
Kaizer Chiefs: Mean xG: 1.5, Median xG: 1.4 | IQR: ~0.8xG
Kaizer Chiefs also stand out with the tightest box among the top teams. 50% of their attacking performances fall within a very narrow range (0.5xG - between 1.2 and 1.7xG). Even on their worst performances, they are always “leaving with something” (in xG terms). The narrow IQR suggest a system that is consistently producing chances - the only problem is that the output is consistently mediocre. Chiefs still take the most shots in the league (a proxy for chances created), but their quality disappoints - Chiefs are 3rd bottom for big chances created. In fact, only 4% of Chiefs’ chances this season can be considered big chances (the lowest ratio in the division).
Sekhukhune Utd: Mean xG: 1.5, Median xG: 1.3 | IQR: ~0.8xG
Early-season pacesetters Sekhukhune are also showing a considerable spread in xG output - a long distance between their worst performance (0.4xG) and their best (3.2xG). Their interquartile range (about 0.8xG) suggests significant swings in output, but not as wild as Sundowns. High variance for any of the teams may also suggest wildly differing tactical adjustments depending on opponents - sitting deep and compact in selected games, then opening up and all out in others. That said, the “horses for courses” approach - while pragmatic, may also suggest tactical insecurity.
At the lower end of the table are teams like Marumo Gallants, Richards Bay and Siwelele, all face dual threats - not only are their boxes tight, they are also at the lower end of the spectrum. Averaging 0.4 - 0.6xG per game, these teams may be consistent, but it is at the wrong end.
We’ll revisit this at the halfway stage of the season to see how things have moved. When evaluating teams, it’s important to look beyond “improving attacks”, scoring more goals or creating more chances per game or “finding form”, but rather to ask:
Is the team’s median xG rising? (i.e the whole box is shifting upwards, not growing bigger).
Is the IQR getting tighter? (A smaller box indicates consistency)
Are outliers becoming less frequent? (reducing dependence on exceptional performances or players)
Later in the season, we can also focus on defensive variance, the other side of the coin. Box plots remove the noise and focus on the message, answering the question every coach has - can we do this again next week or next month? Is that an expectation or a hope? The answers to predictability or volatility are all there in the grey box.
Laduma Analytics uses advanced data collection & statistical modelling to reveal hidden trends & patterns in South African football. Whether you’re a club looking to gain a competitive advantage, a media house seeking better stories, or a brand wanting to connect with football audiences through data, we can help. Get in touch: info@ladumaanalytics.co.za