Sundowns won an unprecedented 14th league title last season, securing 73 points in the process. It’s widely accepted (and correct) that Orlando Pirates and Stellenbosch have a 23-point gap to make up in order to be champions. It sounds like a lot, but is it really? At its simplest, making up a 23 point gap would need Sundowns to drop 12 points, and Pirates/Stellenbosch to win 12 more. Just winning the double-header between the sides would cut that requirement in half (Stellies just beat Downs twice it in the MTN8), then you’re looking at a 12-point swing which can be done in two game weeks. But like many things, what looks simple is not necessarily easy. Another way to look at the nearness of the gap is by using the Expected Points Table from last season.
The definitions
An expected points model simulates the number of goals scored by each side in each match based on the expected goals (xG) value of every shot taken. It then uses the simulated number of goals to determine the match outcome (win/draw/loss). Each match is then simulated over and over (up to 10,000 times). The expected points for each team in each match can then be calculated based on the proportion of simulations they win/draw/lose.
A shorter definition: xPts are the points a team would be expected to take given the quality of chances created and conceded.
Make no mistake, the actual points a team wins matter more than anything. There is no trophy for the most xG and the highest xPts, and xG data is not flawless (there are many things it misses out). Yet, there is a strong argument that Expected Points is a better barometer into team’s performance and it may be a more accurate (not perfect) predictor of future performance.
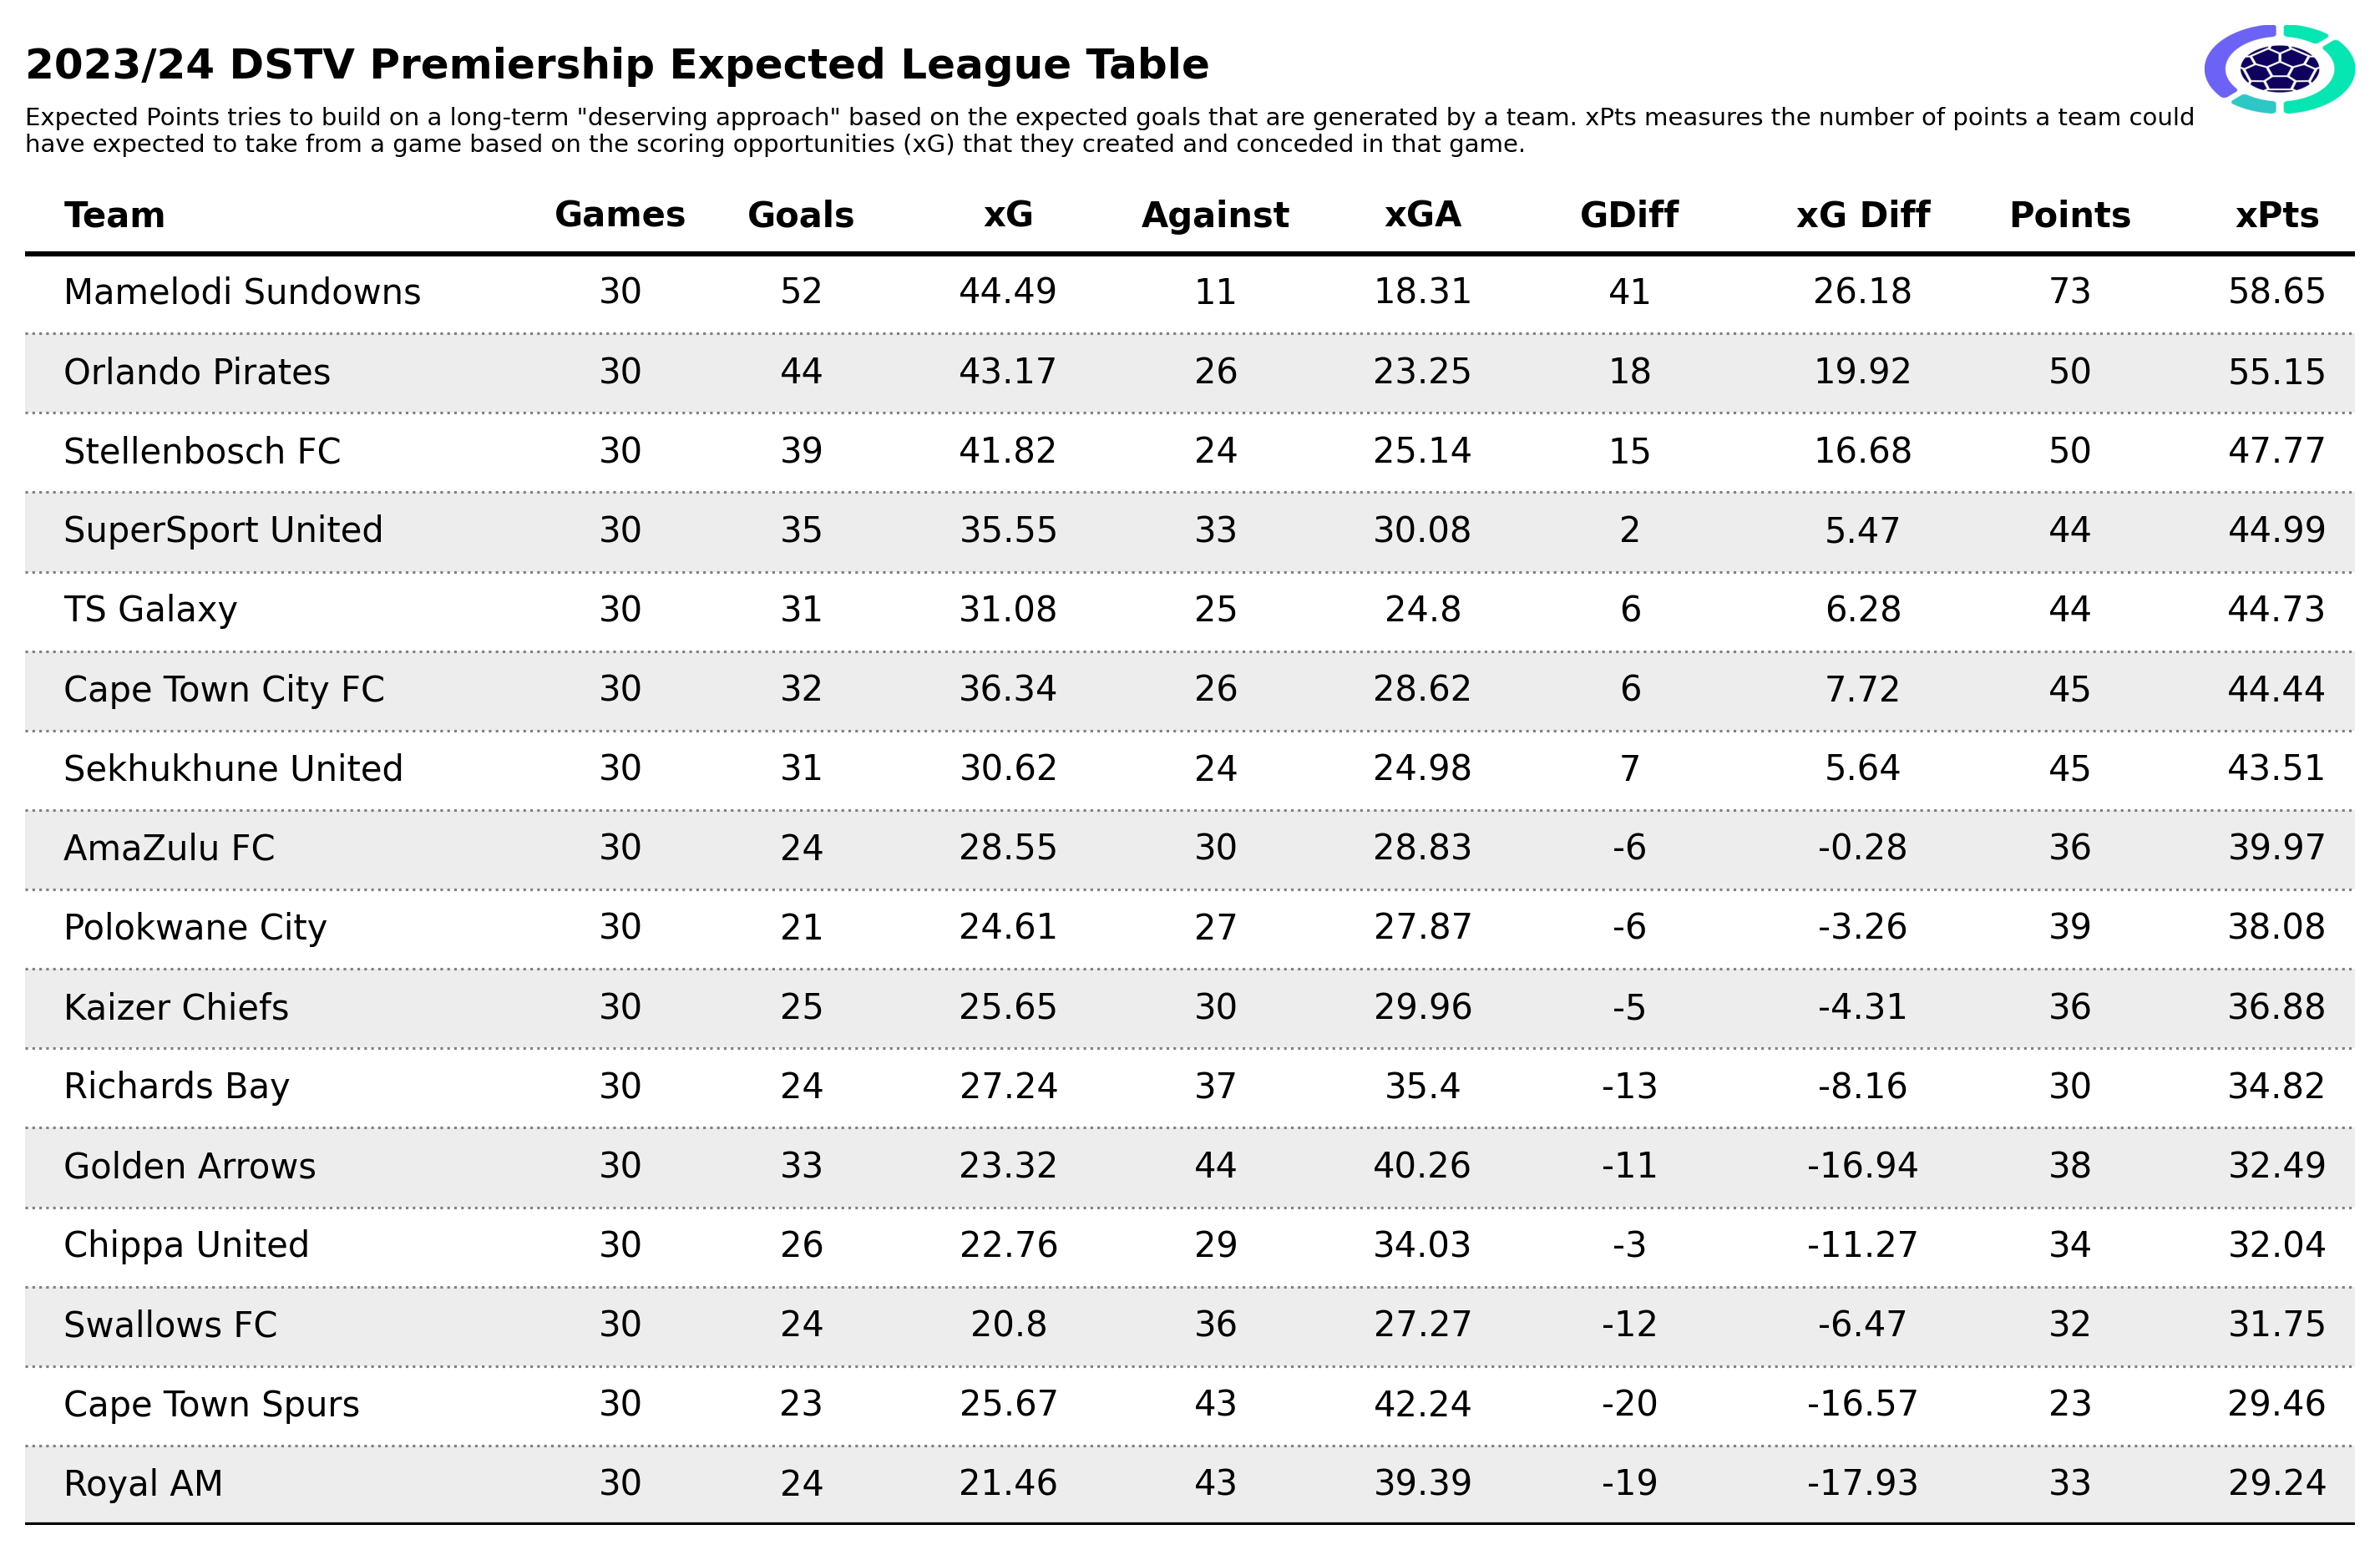
The Over-performers
Even by xPts, Sundowns would be the champions, and the top three would remain the same, in that order. The table suggests a gap of 3.5xPts between Sundowns & Pirates, and closer to 9 between Downs and Stellenbosch. However, Downs over-performed their points by 14, the biggest difference for any team.
You could point to exceptional goalkeeping or outstanding finishing as a primary cause, and we’d lean towards to the latter although this is a hypothesis for now. Golden Arrows (+5.5) and Royal AM (+3.8) also had much higher Expected Points tallies than actual points. For Royal AM, the xPts suggests they should have finished bottom of the league.
The Under-Performers.
Elsewhere, Cape Town Spurs and Orlando Pirates had a big negative difference between their expected points and their actual points, implying that both teams should have been higher than they were on the table. For Pirates, it may not have mattered (they would still be second). But for Spurs, it would have meant potential survival for another top-flight season. The KZN sides, AmaZulu and Richards Bay can also be confident that a little more luck will lead to an improvement in results. Chiefs, meanwhile, would be 10th based on both xPts and Actual Points.
Pirates have consistently got the better of Sundowns in Cups, and Stellenbosch just completed a Cup double over Sundowns. These matches have been very close (and could have gone either way) - but they rarely seem like matches between teams that are 23-points apart. When you also look at how Cape Town Spurs players seem to be the most sought after talents in the transfer window, it points to how unlucky they were on the field more than the quality of their team. There are obviously other factors at play, but maybe the league table can lie once in a while.