Assessing goalkeepers remains one of the toughest jobs in football analysis. Indeed, the further back you move from the forward line, the harder the data becomes to interpret. But one thing is clear: clean sheets alone are not enough.
Four goalkeepers officially kept 10 clean sheets this season. There’s an additional clean sheet for Elvis Chipezeze against Royal AM, but that matches were later “expunged” - a separate debate for whether that should be recorded or not. Ronwen Williams & Sipho Chaine also had one match each where they did not concede a goal but didn’t play the full 90 (by Opta's definition, that doesn’t count as a clean sheet). We anticipate the Goalkeeper of the Season nominee to come from this list, but who deserves it?
Clean Sheets
Clean sheets help narrow down the field, but even they don’t tell the full story. A last-ditch defender tackle can preserve a clean sheet without a save being made by the goalkeeper. Keepers can also keep clean sheets without facing a single shot on target. This happened twice for both Williams and Chaine, and three times for Daren Keet and Chipezeze. Yet, they still deserve credit for organising the defence effectively throughout the game, even if they did not make a save. When viewed proportionally, Williams stands out - 10 clean sheets in 17 games (59%).
Clean sheet rates:
Williams: 59% (10 in 17)
Chaine: 40% (10 in 25)
Chipezeze: 38% (10 in 26)
Keet: 36% (10 in 28)
Goals Conceded
Looking at goals conceded per 90 minutes gives another frame for the picture, especially when keepers have played uneven minutes. The Sundowns pair stand alone here, while others trail further behind. NB. The article focuses on keepers who played a minimum of 10 games.
Goals conceded per 90
Williams: 0.43 per 90 minutes
Onyango: 0.44
Magoola: 0.70
Chaine: 0.74
Sapunga: 0.77
Beyond Clean Sheets (Shot Stopping, Aerial Ability, Sweeping, Errors, Passing)
Shot Stopping
Gianluigi Donnarumma’s shot-stopping during PSG’s Champions League run put shot-stopping back in focus as a core KPI for goalkeepers. Stanley Nwabali, for the second season running, faced the most shots & made the most saves, but he (101) also faced 60 more shots on target than Williams (41) and about 40 more than Chaine (63).
The Top 5 keepers for saves:
Nwabali: 82
Tapé: 77
Chipezeze: 73
Keet: 68
Sangaré: 65
Save percentage also provides a better indicator of efficiency beyond raw saves.
Save percentage (shots on target faced):
Williams: 83% (34)
Onyango: 83% (20)
Nwabali: 80% (82)
Sapunga: 76% (41)
Otieno: 75% (39)
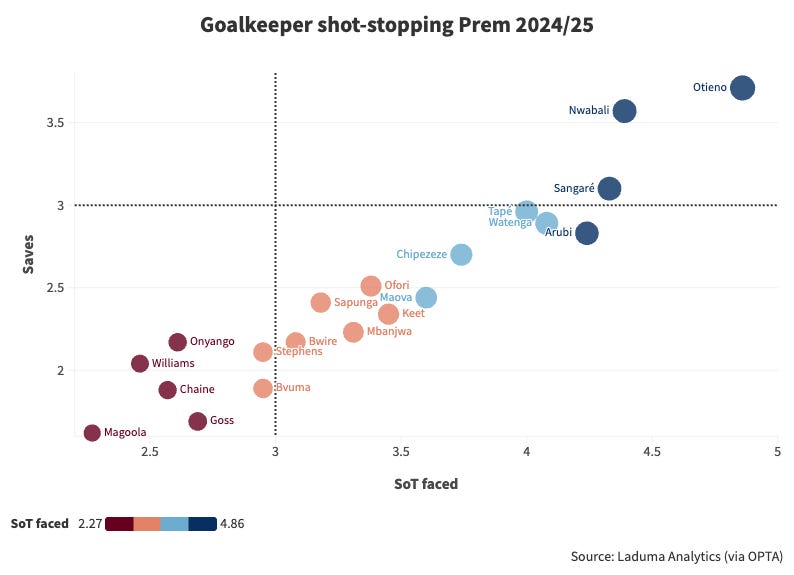
But context matters - some keepers face significantly more shots due to weaker defensive structures. The graph shows a positive correlation: the more shots a goalkeeper faces, the more saves they’re likely to make. That’s expected - keepers behind weaker defences face higher shot volumes, which naturally leads to more save opportunities. Lower shot faced volumes mean fewer chances to register saves.
Aerial Ability
High balls offer another test of keeper quality. OPTA defines a catch as a high ball into the penalty area caught cleanly. The numbers are also influenced by the opposition crossing frequency, and the keeper’s decision-making on when to claim or stay also matters.
Most catches:
Keet: 51
Chipezeze: 29
Tapé: 28
Nwabali: 22
Magoola: 22
Sweeping
A “sweep” is defined by OPTA as “any time a goalkeeper anticipates danger and rushes off their line to try to either cut out an attacking pass (in a race with the opposition player) or to close down an opposition player.”
The keeper must rush out to at least the edge of their area.
There must be at least some pressure from the opposition player racing to the ball
The keeper must react quickly and read the play
Most accurate keeper sweepings (sweep accuracy in brackets)
Williams - 18 (95%)
Mbanjwa - 15 (94%)
Nwabali - 14 (100%)
Arubi, Washington - 13 (93%)
On The Ball
The days of keepers lumping goal kicks long are fading. With an average of 9 goalkicks per game, they are now a key part of the build-up. Short passes, breaking lines, progressing play. Some are more involved than others, but how do they generally rank?
Successful passes (accuracy):
Williams: 629 (88%)
Chaine: 586 (85%)
Keet: 594 (74%)
Nwabali: 564 (71%)
Tapé: 537 (66%)
Errors
We did not witness too many errors directly leading to goals (only Nwabali committed two, according to the definition). It’s a hard metric to fully capture, leaning more towards clear mistakes than poor positioning or judgment calls. There were more instances of drops (“a high ball where the keeper tries to catch the ball, and gets his hands on the ball, but it drops from their grasp”). Most don’t lead to goals, but they expose vulnerability under pressure.
The Top 5 keepers for drops:
Maova, Arubi - 6
Magoola, Keet - 5
Renaldo Leaner is the keeper who played the most minutes (630) without a drop.
Future Analysis
We’ve tried to go beyond clean sheets and saves, but even that barely scratches the surface. Save percentage alone ignores shot quality, shot difficulty, and game state when shots are taken. Metrics like goals prevented, post-shot xG, shot difficulty, shot speed, and reflexes can all add depth in future. We hope to add Goals-Prevented in Part 2, once the Goalkeeper of the Season nominees are confirmed.